Run Chaos Experiment
Now that you have deployed Chaos Mesh in your environment, it's time to use it for your chaos experiments. This document walks you through the process of running chaos experiments. It also describes the regular operations on chaos experiments.
Step 1: Deploy the target cluster
The first step is always to deploy a testing cluster. For illustration purposes, web-show is used as an example cluster because it allows us to directly observe the effect of network chaos. You can also deploy your own application for testing.
After executing the above command, you can access http://localhost:8081 in the browser to check the web-show application.
Note:
If the web-show is deployed on the server, you need to use the host ip to access the application.
Step 2: Define the experiment configuration file
The chaos experiment configuration is defined in a YAML file. You need to create your own experiment configuration file based on the available fields in the sample below:
apiVersion: chaos-mesh.org/v1alpha1
kind: NetworkChaos
metadata:
  name: web-show-network-delay
spec:
  action: delay # the specific chaos action to inject
  mode: one # the mode to run chaos action; supported modes are one/all/fixed/fixed-percent/random-max-percent
  selector: # pods where to inject chaos actions
    namespaces:
      - default
    labelSelectors:
      "app": "web-show"  # the label of the pod for chaos injection
  delay:
    latency: "10ms"
  duration: "30s" # duration for the injected chaos experiment
  scheduler: # scheduler rules for the running time of the chaos experiments about pods.
    cron: "@every 60s"
Step 3: Apply a chaos experiment
Run the following commands to apply the experiment:
# Make sure you are in the chaos-mesh/examples/web-show directory
kubectl apply -f network-delay.yaml
Then you can access http://localhost:8081 in the browser to check the result of the chaos experiment.
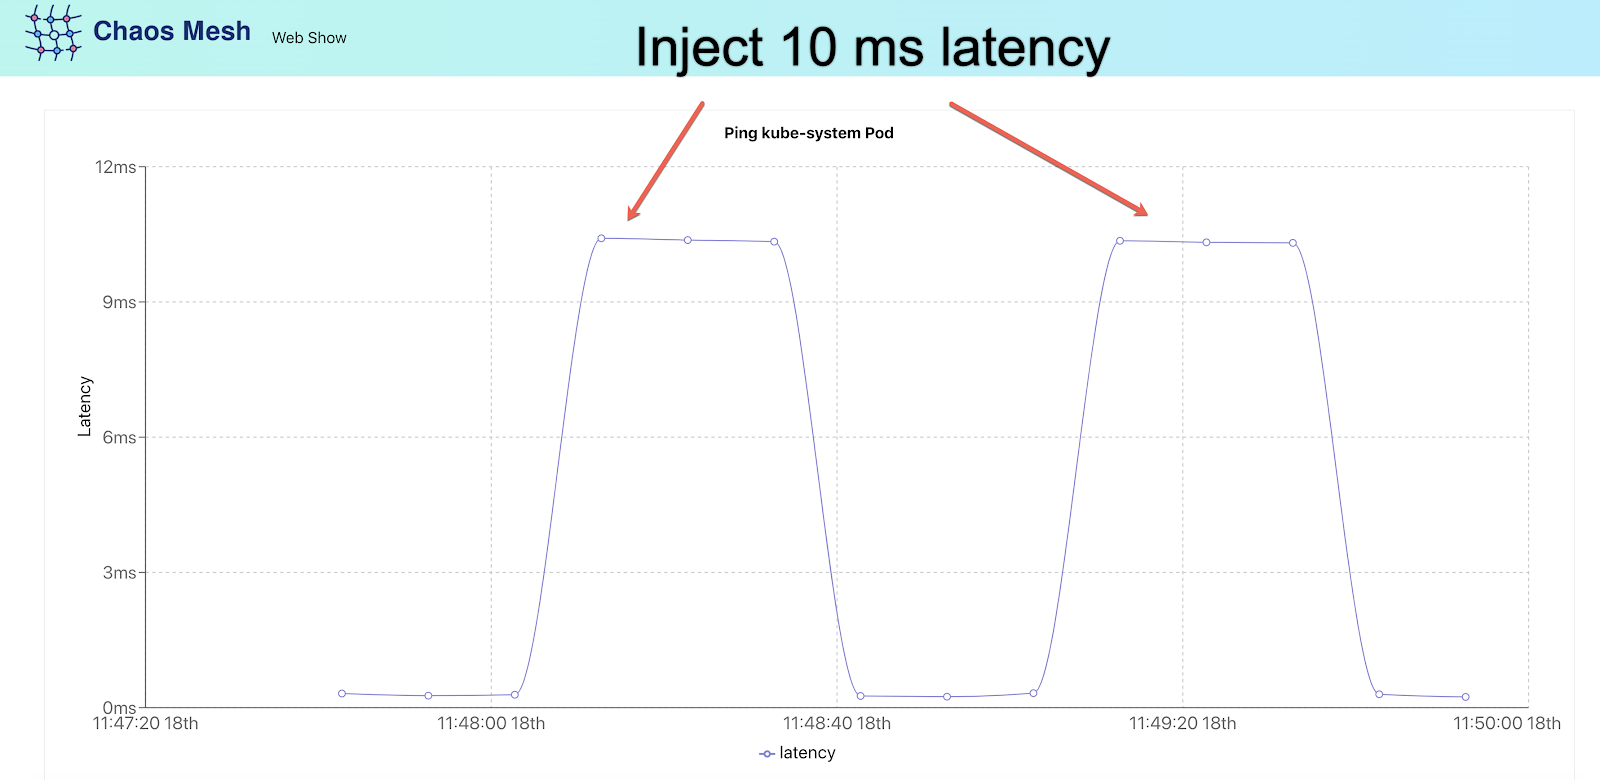
From the line graph, you can tell that there is a 10 ms network delay every 60 seconds. If you are intrigued and want to try out more chaos experiments with Chaos Mesh, check out examples/web-show.
Regular operations on chaos experiments
In this section, you will learn some follow-up operations when the chaos experiment is running.
Update a chaos experiment
vim network-delay.yaml # modify network-delay.yaml to what you want
kubectl apply -f network-delay.yaml
Pause a chaos experiment
kubectl annotate networkchaos web-show-network-delay experiment.chaos-mesh.org/pause=true
Resume a chaos experiment
kubectl annotate networkchaos web-show-network-delay experiment.chaos-mesh.org/pause-
Delete a chaos experiment
kubectl delete -f network-delay.yaml
If you encounter a situation that the delete action is blocked, it means that there are some target pods fail to recover. You can check the log of Chaos Mesh or just feel free to file an issue. In addition, you also can force delete the chaos experiment by the following command:
kubectl annotate networkchaos web-show-network-delay chaos-mesh.chaos-mesh.org/cleanFinalizer=forced
Watch your chaos experiments in Chaos Dashboard
Chaos Dashboard is a Web UI for managing, designing, monitoring Chaos Experiments. Stay tuned for more supports or join us in making it happen.
Note:
If Chaos Dashboard was not installed, upgrade Chaos Mesh by executing
helm upgrade chaos-mesh chaos-mesh/chaos-mesh --namespace=chaos-testing --version v0.2.1 --set dashboard.create=true.
A typical way to access it is to use kubectl port-forward:
kubectl port-forward -n chaos-testing svc/chaos-dashboard 2333:2333
Then you can access http://localhost:2333 in the browser.
To get a quick look of Chaos Dashboard workflow, check out the following articles: